
- Trail-Based Probability of Area Search -
![]() 'Incident Commander
Pro - Version 8'
'Incident Commander
Pro - Version 8'
-
Trail-Based Probability of Area Search -
A Terrain-based Approach to
Probable Search Area
Estimation
by
Martin Colwell
SAR Technology Inc.
 |
|
|
![]() Introduction
Introduction
Assigning probability of areas has long been one of the weakest aspects of search planning. Factors such as POD tables, logistic formulas, shifting POA and Search Priority have all been mathematically defined, yet assigning POA values remains a somewhat subjective and poorly substantiated ‘black art’. Assigning POA’s is a central and extremely important part of the planning process and in practice planners have to carefully consider many factors before assigning the probabilities of areas that will form the basis for the strategy and tactics of the entire search operation.
To assist in the very difficult task of deciding which areas should be searched many
factors must be taken into account. These include the geographical terrain, the subject's
age, fitness, mental health, personality and extent of local knowledge. The time available
by the subject to complete the route, the weather at that time, the previous incident
history of the local region and the general statistical behaviour of that type of subject
are all included in the process that leads to assigning the search's probability of areas.
Even the personality and opinions of those 'experts' who are helping to assign these
probability of area's has to be considered and a consensus procedure is often put into
place to help provide a more objective approach to the weighting of all the POA
contributing factors.
![]() Consensus-based Probability
of Area
Consensus-based Probability
of Area
The classic consensus method of Probability of Area assignments, as originally proposed by Mattson (ref. 1) of the US Air Force, is based upon an assessment, by local 'experts', that the subject has moved into one of a number of pre-defined search areas. The 'experts' assessment of the likelihood of the subject moving into each of these areas is a semi-subjective blend combining the previous incident history for the region, local terrain evaluation and a judgment of the expected mental and physical condition of the subject. Using these factors the 'experts' then weight the probability that the subject will be in each of the designated search areas. The averaged assessments of a small group of these 'experts' is then used to provide the consensus-based probability of area's (ref. 2).
It should be remembered that the ‘experts’ opinions are based upon a significant amount of experience and local knowledge. This judgment is usually of great value and is often correct in predicting the location where the subject might be found. However there are occasions where this expert knowledge is either inadequate, typically due to a lack of comparable incidents, or that their assessments have failed to correctly predicted the location of the subject.
Some of the advantages of the ‘experts’ consensus method include:
![]() Most of the major contributing factors,
i.e. previous local history, environmental conditions and subject profile are
included in the consensus.
Most of the major contributing factors,
i.e. previous local history, environmental conditions and subject profile are
included in the consensus.
![]() The method has historically been quite
successful in locating missing persons.
The method has historically been quite
successful in locating missing persons.
Disadvantages of the consensus method include:
![]() The ‘experts’ subjective
opinions may simply be wrong or perhaps unconsciously biased.
The ‘experts’ subjective
opinions may simply be wrong or perhaps unconsciously biased.
![]() Statistically-based
Probability of Area
Statistically-based
Probability of Area
A more rigorous approach to POA assignments uses historical incident data to assign POA's to each potential search area. Statistical missing person behaviour characteristics, such as the median distance traveled, the probability of uphill or downhill movement, and various distance-traveled 'probability bands' can be used to help define approximate search areas. A large database of this type of missing person behavior data has been collected over the years (ref. 3) which can be of great value in determining at least general patterns of travel behaviour for different types of subjects. Unfortunately one major disadvantage of this type of historically-based statistical data is that it was collected continent-wide from across the US and may sometimes be quite irrelevant to the local geography of the specific search region.
An often more valuable source of statistical probability of area data is based upon the local incident history of the search region. This local incident history records how many subjects have been found in each of the defined search areas over the past number of years. The POA's for these various area's are then assigned in direct proportion to the number of subject's that have been found in each of the search areas.
![]()
![]() The major advantages of this statistical approach are:
The major advantages of this statistical approach are:
![]() Genuine field-derived
historical data is used exclusively to assign objective POA's.
Genuine field-derived
historical data is used exclusively to assign objective POA's.
![]() The POA's assigned avoid the
subjectivity of 'expert' opinions.
The POA's assigned avoid the
subjectivity of 'expert' opinions.
![]()
![]() Disadvantages of the statistical method include:
Disadvantages of the statistical method include:
![]() The procedure will not work
where no historical missing person data has been collected.
The procedure will not work
where no historical missing person data has been collected.
![]() The procedure ignores the
possibility that the subject may be in an area where no previous subjects have been found.
The procedure ignores the
possibility that the subject may be in an area where no previous subjects have been found.
![]() The significance of
contributing environmental conditions and subject profiles are ignored.
The significance of
contributing environmental conditions and subject profiles are ignored.
Both consensus-based and statistically-based POA estimations have intrinsic advantages. In practice SAR planners will frequently tend to choose whichever approach appears to have the greatest quantity of useful support information available for developing the POA's.
Under the not uncommon circumstance where very little direct planning information has become available both procedures can provide quite poorly-substantiated POA assignments, which may then be little better than educated guesses.
An example of an incident in which neither of the above POA assignment approaches would be of much value could include:
The subject is an experienced, fit hiker in a good frame of mind, easily capable of completing the hike to a known destination from a confirmed starting point. He/she appears to have allowed adequate time to complete the trip, which was undertaken in good weather conditions. The trail has no significant physical barriers, such as a very steep uphill section or a tricky creek crossing, and there is no previous history of anyone becoming lost on this trail before.
An incident such as this would not provide much historical, environmental or subject profile information on which to develop well-substantiated POA assignments, which ought to be based in part on where it could be expected that the subject may have deviated off his/her intended route.
![]() Trail-based Probability of
Area
Trail-based Probability of
Area
A new method for assigning POA's is proposed that may be utilized under some circumstances where there is insufficient data to produce meaningful consensus-based or a historically-based probability of areas. This new method is called Trail-based Probability of Areas.
![]() Background
Background
Many searches have been conducted based on the assumption that the subject(s) were, at least initially, following a recognized trail (or route) from a known point of origin (Last Known Point) to an expected destination. If the weather was good, the trail well-marked, the subject reasonably fit and adequate time has been allowed for the complete trip it can sometimes be difficult to come to any kind of consensus-based POA as to where the subject may have strayed off the trail and become lost. If the region also has a very limited history of previous lost-person incidents then there is very little locally-relevant data for assigning either consensus-based or historically-based probability of areas.
Under these circumstances, where the subject was expected to have followed, at least initially, a recognized trail or route, performing trail-base probability of area assignments may be a useful new planning tool.
 Trail-based Probability of Areas - for a Single Trail
![]()
![]() Trail-based POA Assignment
Procedure:
Trail-based POA Assignment
Procedure:
The trail-based POA procedure makes the assumption that the subject followed the intended trail or route for some distance before leaving the trail for reasons that are usually unknown.
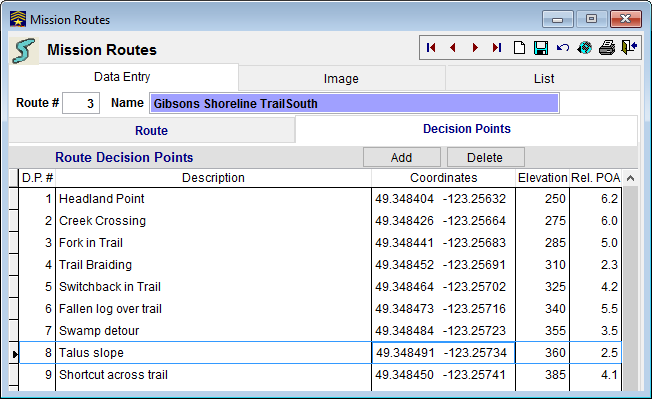
1. During the initial hasty search the searchers are asked to record every point along the main trail between the starting point (Point Last Seen) and the destination where there appears to be any likelihood that the subject may have potentially been tempted to leave the trail.
These points are called Decision Points (ref. 4). They would include misleading dead-end side trails, overshoots off switchbacks, minor trails of any sort that intersect with the main trail, enticing 'natural routes' that appear to follow easier ground, apparently easier shortcuts, sections of braided trail and visible 'attraction points', such as viewpoints, shelters, water sources etceteras, off the main trail.
2. Each of these Decision Points is flagged and recorded at base with an ID Number, Description and Location, e.g. DP #1: Fourth uphill switchback from creek, Location (UTM/LatLong).
3. The hasty team reporting the Decision Points is also asked, at the same time,
to provide an estimate of the probability that 'The subject may have left the trail at
that Decision Point'. They are asked to use the standard Relative POA Rating scheme
where:
Relative POA
The Probability of the Subject Leaving the Trail at this Decision Point
is: Very
Likely 9.0
Likely
7.0
Even
Chance 5.0
Unlikely
3.0
Very
Unlikely 1.0
|
|
|
![]() 'Incident Commander
Pro' records
Trail/Route Decision Points.
'Incident Commander
Pro' records
Trail/Route Decision Points.
To improve the consistency of these POA assessments each reported POA rating should be the average of each field team member's individual assessment of that Decision Point.
Some field teams may be more comfortable using the descriptive Relative POA terms, such as 'Unlikely' which the search manager will then convert to a numerical POA value, e.g. 3.0. With practice the field teams may become used to the idea of assigning POA numbers, such as '2.5', for a probability that is 'slightly less than Unlikely' that the subject left the trail at this Decision Point.
4. The data for that Decision Point is then more fully expressed to include its
POA rating e.g.:
DP #1: 2.5 Fourth uphill switchback from creek, Location (UTM/LatLong).
5. This process is repeated at each Decision Point as the hasty team travels the entire length of the trail that the subject could have followed.
To ensure consistent recognition and assessment of these DP's and their POA's it is important to ensure that, wherever possible, only one team Decision Point POA-rate an entire trail. To make this assessment as accurate as possible it is preferable to have this field team travel in the same (probable) direction as the subject and at the same time of day and weather conditions that the subject was thought to have experienced when he/she travelled the trail.
6. When the hasty team have completed searching the main trail and all the Decision Points and their relative POA's have been assigned, the search manager then breaks the trail down into sections, using natural geographic features that would help define distinct search areas. These sections could include drainage basins, slopes on the uphill and downhill side of the main trail, areas on either side of the main trail and other natural regions, such as forested sections, benchlands or other distinct features through which the trail passes. Each of these areas is given an Area Number e.g. Area #4 (Mt. Brunswick's uphill slope).
Note: If these search areas are too large to be readily searched in one day they will later have to be divided into day-searchable segments.
7. The search manager then sums (totals) all of the Decision Points' numerical POA Ratings within that search area. For example along the Main Trail's Area #4 there are six Decision Points to be summed:
| Table 1. Assigning a Trail-based Relative Probability of Area |
||||
Decision |
Trail- |
Main Trail: thro' Area#4, |
Decision Point |
|
Area & |
Relative |
Decision Point |
Elevation |
UTM or |
Area #4 DP#1 |
0.8 |
Deer trail goes south |
1250m |
789465 |
Area #4 DP#2 |
0.4 |
Detour to southside of bog |
1265m |
790469 |
Area #4 DP#3 |
2.1 |
False switchback overshoot |
1320m |
792472 |
Area #4 DP#4 |
3.6 |
Small meadow to south |
1360m |
792476 |
Area #4 DP#5 |
1.4 |
Sidehill route to lookout |
1385m |
793481 |
Area #4 DP#6 |
3.5 |
Shortcut downhill to highway |
1410m |
795490 |
Area #4 Relative
POA: |
11.8 |
. | . | . |
|---|---|---|---|---|
8. This process of summing the POA's for all the Decision Points within each designated search area is repeated for all of the search areas. This will then produce a list of relative POA's for all of the search areas.
9. The final step totals this list of relative POA's for all the search areas along the trail and then normalized them, including the 'Rest of World' POA, which was estimated to be 5% in this example:
|
Table 2. Trail-based Probability of Areas - for a Single Trail
|
|||||
Area |
Single MainTrail: |
Relative |
Relative |
Normalised Area %POA |
|
Area #1 |
Harvey Basin |
4.9 |
(4.9/30.6) x |
95 = | 15.2% |
Area #2 |
Sisters Forest |
5.9 |
(5.9/30.6) x |
95 = | 18.3% |
Area #3 |
Yew Lake Meadow |
3.8 |
(3.8/30.6) x |
95 = | 11.8% |
Area #4 |
Mt. Brunswick's Uphill Slope |
11.8 |
(11.8/30.6) x |
95 = | 36.6% |
Area #5 |
Mt. Brunswick's Downhill Slope |
2.6 |
(2.6/30.6) x |
95 = | 8.1% |
Area #6 |
Black Mountain's East Side |
1.6 |
(1.6/30.6) x |
95 = | 5.0% |
All Areas: |
RelativeTotal Area POA = |
30.6 | Total: | . | 95.0% |
|---|---|---|---|---|---|
| Rest of World: | . | . | ROW: |
. | 5.0% |
 |
|
|
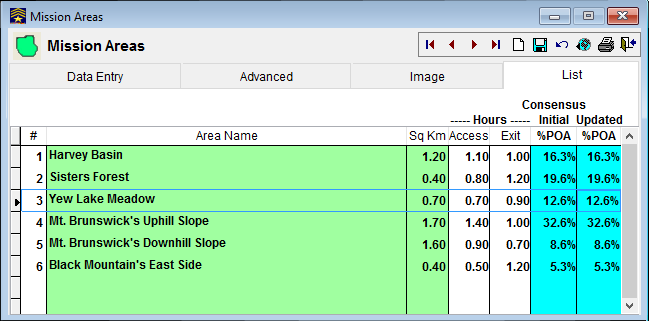
![]() 'Incident Commander
Pro' calculates
Mission Areas %POA from Trail/Route Decision Points.
'Incident Commander
Pro' calculates
Mission Areas %POA from Trail/Route Decision Points.
Figure 1 illustrates the single trail-based POA assignment procedure detailed in Table's 1 and 2 above, implemented on the trail map example.
The normalized %POA's for each search area, shown in Figure 1 and Table 2, may then be
used, along with POD and manpower estimates, to calculate the Search Priority (refs.5,
6) of each area assignment.
![]() Figure 1: Single Trail-based POA
Figure 1: Single Trail-based POA ![]()
 Trail-based
Probability of Area - for Multiple Trails
Trail-based
Probability of Area - for Multiple Trails
In the event that the main trail between the Last Known Point and the destination has clearly defined side trails branching off the main trail - or if there are a number of obvious trails that could have been traveled within the local search area - trail-based POA's can be obtained that include areas around all of these trails. The process is essentially the same as that described above for a single (main) trail except that POA Trail Weighting Factors are applied to both the main trail and each significant branch trail or, in the instance of a number of obvious trails, to the complete set of these local trails.
Using an example of one main trail with two branch trails the same procedure described
above for a single trail is applied: total all the Decision Point's relative POA's within
each of the search areas' along the trail. Repeat this procedure for each of the three
trails. When all the trails have been assigned their relative total area POA's each trail
is then given an estimated overall POA Trail Weighting Factor. This Trail Weighting Factor
is the estimated probability that subject may have traveled along that section of trail.
- The Trail Weighting Factors for all of the trails must add up
to one (unity).
(This weighting factor has also been referred to as the Scenario Probability Factor (ref.7)).
A %POA value for the 'Rest of World' (ROW) must also be included. In this example the 'Rest of World' POA was estimated to be 5.0%.
This example of trail-based POA's for multiple trails is shown in Table 3 below:
| Table 3. Trail-based Probability of Areas - for Multiple Trails
|
||||||
Trail ID |
Area |
Relative |
Relative |
Trail Weighting Factor |
(100 -ROW) |
Normalised Area %POA |
Main Trail |
. | . | . | 00.70 |
. | . |
Area #1 |
Harvey Basin |
4.9 |
(4.9/30.6) x |
0.70 x | 95 = | 10.65% |
Area #2 |
Sisters Forest |
5.9 |
(5.9/30.6) x |
0.70 x |
95 = |
12.82% |
Area #3 |
Yew Lake Meadow |
3.8 |
(3.8/30.6) x |
0.70 x |
95 = |
8.26% |
Area #4 |
Mt.Brunswick Upslope |
11.8 |
(11.8/30.6) x |
0.70 x |
95 = |
25.64% |
Area #5 |
Mt.Brunswick Downslope |
2.6 |
(2.6/30.6) x |
0.70 x |
95 = |
5.65% |
Area #6 |
Black Mountain's East Side |
1.6 |
(1.6/30.6) x |
0.70 x |
95 = |
3.48% |
| . | RelativeTotal Area POA = | 30.6 | . | . | . | . |
| EscapeTrail | . | . | . | 0.20 |
. | . |
Area #7 |
Talus below Escape Trail |
3.5 |
(3.5/20.6) x |
0.20 x |
95 = |
3.23% |
Area #8 |
Talus above Escape Trail |
2.6 |
(2.6/20.6) x |
0.20 x |
95 = |
2.40% |
Area #9 |
Cliffbands below Escape Trail | 8.5 |
(8.5/20.6) x |
0.20 x |
95 = |
7.84% |
Area #10 |
Alder Slope South of Pass |
6.0 |
(6.0/20.6) x |
0.20 x |
95 = |
5.53% |
| . | Relative Total Area POA = | 20.6 |
. | . | . | . |
SummitTrail |
. |
. |
. |
0.10 |
. |
. |
Area #11 |
North side of Summit Trail |
0.8 |
(0.8/2.5) x |
0.10 x |
95 = |
3.04% |
Area #12 |
South side of Summit Trail |
1.1 |
(1.1/2.5) x |
0.10 x |
95 = |
4.18% |
Area #13 |
Grass slopes below summit |
0.6 |
(0.6/2.5) x |
0.10 x |
95 = |
2.28% |
| . | Relative Total Area POA = |
2.5 |
. | . | . | . |
All Areas: |
. | . | . | 1.00 |
Total: |
95.00% |
Rest of World: |
. | . | . | . | ROW: |
5.00% |
Figure 2 illustrates this multiple trail-based POA assignment procedure detailed in Table 3 above implemented on the trail map example.
![]() Figure 2: Multiple Trail-based POA
Figure 2: Multiple Trail-based POA
The example above illustrates how thirteen search areas around three trails (which may or may not be connected) can been assigned %POA values based solely on an evaluation of the trails' geographical features. As mentioned above these %POA values may then be used in Search Priority calculations, along with POD and manpower requirements, to determine the search priority of each area.
![]() Benefits of Trail-based
Probability of Area Assignments
Benefits of Trail-based
Probability of Area Assignments
The benefits of trail-based POA assignments include the fact that both the number of Decision Points and the relative probability that the subject left the trail at each of those points, are used together to calculate the POA of each area adjacent to the trail. In an area with many Decision Points, or where the Decision Points have a high likelihood of luring the subject off the trail, the probability of area, adjacent to that section of the trail, may be fairly high. In an area where the trail is clearly marked, with very few Decision Points, the POA for that area will usually be quite low. This trail-based POA procedure forces the hasty team and search managers to examine in some detail many specific trail-terrain features. It also requires that the field teams attempt to think much more like the subject, and consider carefully at each Decision Point the probability that the subject may have deviated off-route from this location.
![]() Limitations of Trail-based
Probability of Area Assignments
Limitations of Trail-based
Probability of Area Assignments
The trail-based POA assignment procedure works best on known, recognized trails, especially when the trail has a number of obvious Decision Points along its route. If the trail is very clearly marked with no Decision Points, or where the trail has very few Decision Points, with only low probabilities that the subject left the trail, the procedure will provide, at best, very low relative POA ratings. Under these circumstances this trail (terrain)-based POA approach may not provide meaningful POA data, in which case one of the alternative approaches, i.e. consensus-based or statistically-based POA assignments, will have to be utilized.
A further potential limitation of trail-based POA is that it does not intrinsically take into account potentially valuable information derived from either consensus-based or statistically-based POA assignments. Similarly these latter two methods do not intrinsically take into account the direct field information derived from trail-based POA’s.
![]()
![]() Weighted Probability of Area
Assignments
Weighted Probability of Area
Assignments
Weighting the POA’s derived from either the ‘experts’ consensus-based POA’s or the statistically-based POA’s with the trail-based POA’s permit us to balance information derived from historical or statistical data with that derived directly from the field teams. For example, historical data may indicate that most subjects of a certain type are lost within a statistical distance range from the Point Last Seen. If this higher priority distance range POA is blended with the local terrain-based POA assessments, then the trail-based POA’s can be weighted towards this statistically significant distance range.
The degree of weighting of the consensus-statistical POA estimates against the trail-based POA estimates towards the blended POA’s can be adjusted to emphasize whichever approach is believed to be the most relevant to the current incident. For example; if good historical POA data is available for the search region then the POA blending can be weighted towards the consensus-statistical POA assignments, however if at the time of the incident trail visibility conditions were poor then the blended POA’s could be weighted towards a recently obtained trail-based POA assessment.
Using the previous multiple-trail example to weight the Trail-based and consensus POA’s for Area #1;
POA
Trail-based:Concensus Trail-based
Concensus-Statistical Weighted
Emphasis Weighting Factor
POA
POA
POA
Equal
0.5
: 0.5 (10.65% x
0.5) + (6% x 0.5) =
8.325%
Trail-based 0.7 : 0.3
(10.65% x 0.7) +
(6% x
0.3) = 9.255%
Concensus-based 0.3 : 0.7
(10.65% x 0.3)
+ (6% x 0.7) =
7.395%
Continuing this POA weighting procedure for all of the search areas in the multiple-trail example:
![]()
![]() Table 4.
Table 4.
Weighted Trail-based & Consensus Probability of Areas - for Multiple Trails
Trail ID |
Area |
|
|
0.5 : 0.5 Weighted Trail:Concensus Area %POA |
0.7 : 0.3 Weighted Trail:Concensus Area %POA |
Main Trail |
. | . | . | . |
. |
Area #1 |
Harvey Basin |
10.65% |
6% |
8.32% | 9.255% |
Area #2 |
Sisters Forest |
12.82% |
6% |
9.41% |
10.774% |
Area #3 |
Yew Lake Meadow |
8.26% |
20% |
14.13% |
11.782% |
Area #4 |
Mt.Brunswick Upslope |
25.64% |
15% |
20.32% |
22.448% |
Area #5 |
Mt.Brunswick Downslope |
5.65% |
5% |
5.825% |
5.755% |
Area #6 |
Black Mountain's East Side |
3.48% |
5% |
4.24% |
3.936% |
| EscapeTrail | . | . | . | . |
. |
Area #7 |
Talus below Escape Trail |
3.23% |
5% |
4.115% |
3.761% |
Area #8 |
Talus above Escape Trail |
2.40% |
2% |
2.20% |
2.28% |
Area #9 |
Cliffbands below Escape Trail | 7.84% |
8% |
7.92% |
7.888% |
Area #10 |
Alder Slope South of Pass |
5.53% |
3% |
4.265% |
4.771% |
SummitTrail |
. |
. |
. |
. |
. |
Area #11 |
North side of Summit Trail |
3.04% |
2% |
2.52% |
2.728% |
Area #12 |
South side of Summit Trail |
4.18% |
2% |
3.09% |
3.526% |
Area #13 |
Grass slopes below summit |
2.28% |
15% |
8.64% |
6.096% |
All Areas: |
. | 95.00% |
95.00% |
95.00% |
95.00% |
Rest of World: |
. | 5.00% |
5.00% |
5.00% |
5.00% |
From this example in Table 4 it can be seen that, compared to equally-weighted
POA’s:
- when trail-based POA weighting is increased all the areas with greater trail-based
POA’s than consensus-based POA’s raise their POA’s and all the areas with
lower consensus-based POA’s than trail-based POA’s reduce their POA’s.
Similarly if the consensus-based POA’s weighting is increased beyond equal weighting:
- all the areas with greater consensus-based POA’s than trail-based POA’s raise
their POA’s. and all the areas with lower trail-based POA’s than consensus-based
POA’s reduce their POA’s.
In this example the adjacent areas #3, #4 and #13 are within the statistical distance range that have high consensus-statistical POA’s. These higher POA ratings when equally weighted against the trail-based POA’s give these three areas higher weighted POA’s than almost all the other search areas. As such, if all other factors are equal, these three areas would be given a high search priority.
This example illustrates the capability of weighted POA’s to respond sensitively across all the search areas from solely trail-based POA assessment emphasis, through any POA weighting, to solely consensus-based POA assessment. Thus the contribution of both POA assessment methods can be finely adjusted by the search manager to produce a weighted POA that reflects the emphasis he/she feels should be given to both the concensus-statistical and field-derived trail-based POA data for the current incident.
![]() Trail-based POA -
Implementation during Searches
Trail-based POA -
Implementation during Searches
When the hasty team is conducting its initial hasty search of the trails the search manager should, whenever possible, request that the team report and POA-rate all of the Decision Points they observe as they complete their initial assignments. This will remove the necessity of having to repeat a sweep of the trail later just to identify and POA-rate each of the Decision Points. However if the initial assessment conditions are not reasonably close to those that the subject probably experienced (for example the hasty team is searching by night in one direction and the subject probably traveled by day, in the opposite direction) then the DP-rating of the trail may have to be performed later under conditions more closely resembling those probably experienced by the subject.
It is generally good practise for search managers to define probable search areas during pre-planning sessions prior to a conducting a real search. However if these areas have to be defined at search time, using consensus-based or-statistical POA data, for the initial hasty-team deployments, these defined areas can be used later in the search as the areas into which the trail-based decision-points may be distributed, as this field data is collected. Obviously the later trail-based POA data may indicate that some defined search areas may have to be adjusted to reflect the new POA information received from the field.
![]() Pre-Planning for Trail-based POA
Assignments
Pre-Planning for Trail-based POA
Assignments
SAR pre-planning programs could include Decision Point data collection during trail familiarization training tasks for the team. This not only familiarizes the team with the trail but also with the Decision Point data collection process, which they may later have to provide during a genuine search incident. This Decision Point data may then be summed as detailed above to produce a set of pre-planned trail-based POA's for each popular trail within the teams jurisdiction. This type of POA pre-planning is invaluable as it provides 'hard' POA data with which to assign realistic search areas and may also help to markedly speed up the field teams deployment process.
![]() Conclusions
Conclusions
The Trail-based Probability of Area procedure can be a useful tool for assigning POA's when the traditional consensus-based and statistically-based POA assignment approaches are not substantiated by much supporting data. Alternatively the Trail-based POA procedure may be used to reinforce and fine-tune well-substantiated statistically-based or concensus-based POA data, by weighting these ‘theoretical’ POA’s with locally obtained terrain-based POA data, submitted by hasty teams employing the Trail-based POA procedure. The search manager may also define the relative contributions of these ‘theoretical’ and ‘Trail-based’ POA’s by adjusting their POA weightings to most closely match the current conditions of the search.
On many trail systems, especially those with confusing or misleading sections, or on trails traveled outside of the normal hiking season, when the trail may be partially obliterated or unclearly marked, it may be an especially helpful procedure. The procedure does require pre-planning to work effectively but this can be implemented early in the search incident or may be incorporated into the team's trail familiarisation training exercises.
Copyright M.Colwell 1997-2016
This article may be freely distributed for personal, non-profit and
educational purposes only.
Commercial use of any of this material is unauthorized.
References:
1. Mattson, R.J. "Establishing Search Priorities." Handout 1975
2. Emergency Response Institute, "Search is an Emergency" Fourth
Edition 1995. Chapter 17, pp138 'Establishing the Search Area'.
3. Mitchell, B "Summaries of the National Association for Search &
Rescue Data Collection and Analysis" NASAR 1980-1985
4. E. Cornell, C. Donald Heth, Y. Knuebuhler, S. Sehgal. "Serial Position
effects in Children's Route Reversal Errors: Implications for Search Operations"
University of Alberta Department of Psychology Technical Report 03-10-94 (Reference under:
'Choice Points').
5. Emergency Response Institute, "Search is an Emergency" Fourth
Edition 1995. Chapter 19, pp166-168 'Search Priority". 6 M.Colwell. "Search
Priority, an Integrated Approach to Search Planning" Emergency Response
Institute, 1994 7 Dr. K. Hill "Analyzing Lost Person Scenarios" NASAR 'Response'
Magazine, Winter 1992
![]()
For more information please contact:
![]() SAR
Technology Inc.
SAR
Technology Inc.
Phone:
(604) 921-2488  Fax
(604) 921-2484
Fax
(604) 921-2484 ![]() sartechnology@telus.net
sartechnology@telus.net
 |
SAR Technology Inc. |  |
View / Save / Share |